Debugging and troubleshooting are a normal part of learning to code; it is common to encounter errors. Understanding error types, debugging tools, and different approaches to problem solving can make the process of detecting and fixing bugs less overwhelming.
Error Types
There are several ways to classify debugging issues. Two common categories are syntax errors and logic errors.
Syntax Errors
These are usually much easier to find and correct. An example would be in C# declaring a variable with the identifier count, then later referring to it as Count.
int count=0;
Count = 10; //Count is interpreted as a different entity than count
C# is case sensitive. count and Count are interpreted as two separate entities. An IDE (Integrated Development Environment) like Visual Studio highlights syntax errors and provides hints as to how they might be fixed.
Logic Errors
These types of errors are generally far more difficult to find and solve. IDEs usually can’t detect the problem. Logic errors are usually only discovered when the application behaves in an unusual way (for example, gives a result you weren't expecting).
Often a logic error occurs when we make a mistake in our programming logic, but our application still compiles and runs. When we look back through the code we discover the application is indeed doing what we asked of it, however we just asked for the wrong thing by mistake.
With complex problems there is typically no one "right" or "wrong" solution; instead you find a range of ideas from less successful to more successful. As you progress in your learning and encounter more complex problems you may have a wide range of viable solutions. This is part of the art of programming - choosing the best solution for a situation.
Problem Solving Approaches
There are many methods you can use to detect and solve errors in your code. Two approaches new programmers might want to try are walking through the code and experimentation.
Walking Through Code
A helpful option when you are having programming errors is to explain to someone else what your program should be doing. Walk through each line of code and explain what it does and what should be happening.
Often just explaining to someone else what the code is supposed to do helps you find out where the error is. This can work with someone who knows nothing about programming, or even an inanimate object (see "rubber duck debugging" from the book The Pragmatic Programmer). You might get partway through the explanation and have an "a ha" moment where you see where the error is.
Experimenting
Experimenting with code is an important part of learning a programming language. For many programmers a concept is not fully understood until code has been written, added to, broken, trouble-shooted, debugged, and fixed. This process often reveals new ways of thinking about and solving a problem.
For example, without an IDE it is sometimes difficult to find out which line contains a bug. You can experiment by commenting out the statement lines you think contain the problem. If the application compiles and runs, you can try un-commenting out lines until the application no longer compiles. Once you've found where the bug is at, you can check your syntax for errors, or see if there is a problem with your logic.
When experimenting with your code, save iterative versions. This allows you to "roll-back". If you make a change down the line that you wish to "undo", you can simply go back to the previous version.
Debugging Tools
Stepping Through Code (Visual Studio)
In Visual Studio you can "step" through your code. This allows you to watch as each line runs, and the values that your variables are storing at each point in the application's life span.
You can start this process in Visual Studio by just pressing the F11 key. This will highlight the first line of code that will run. Press F11 again to move to the next step. As you move through the code, you can see the values of your variables change in the window at the bottom (see screenshot below).

Breakpoints (Visual Studio)
A breakpoint is a signal that tells the debugger to temporarily suspend execution of your program at a certain point. You can add one by clicking on the line you want a breakpoint at, then pressing F9. You'll see a red dot to the left of the line when a breakpoint is active. To turn the breakpoint off, just press F9 again.
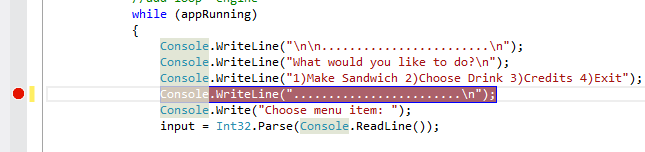
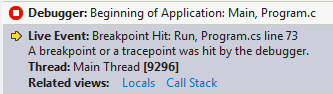
As your program runs, you can see it suspend when it reaches the breakpoint:
Practice problem solving: Debugging Code: Poem Generator (C#)